Skip to content
woodfrog
Industries · Logistics

On time, in full. Fewer empty miles.

For transporters, 3PLs and warehouses. We connect TMS, WMS and GPS data so every truck and dock earns more.

Contact usAt least 3× return within 12 months.

Where a typical truck loses its day

Illustrative
Available timeWaiting at docksEmpty runningBreakdownsUtilised

Trucks earn only while loaded and moving. We show where each hour goes, by vehicle, lane and customer.

The numbers we move
  • OTIFOn time, in full
  • UtilisationLoaded hours of the day
  • Empty milesKilometres run without load
  • Dwell timeHours at docks
  • Cost per tripAll in, per lane
  • Dock to stockHours to put away
  • Pick accuracyOrders picked right
  • Billing accuracyInvoices right first time
Problems we fix

Five problems every logistics head knows.

Cost figures are illustrative, not woodfrog results, unless linked to a case.

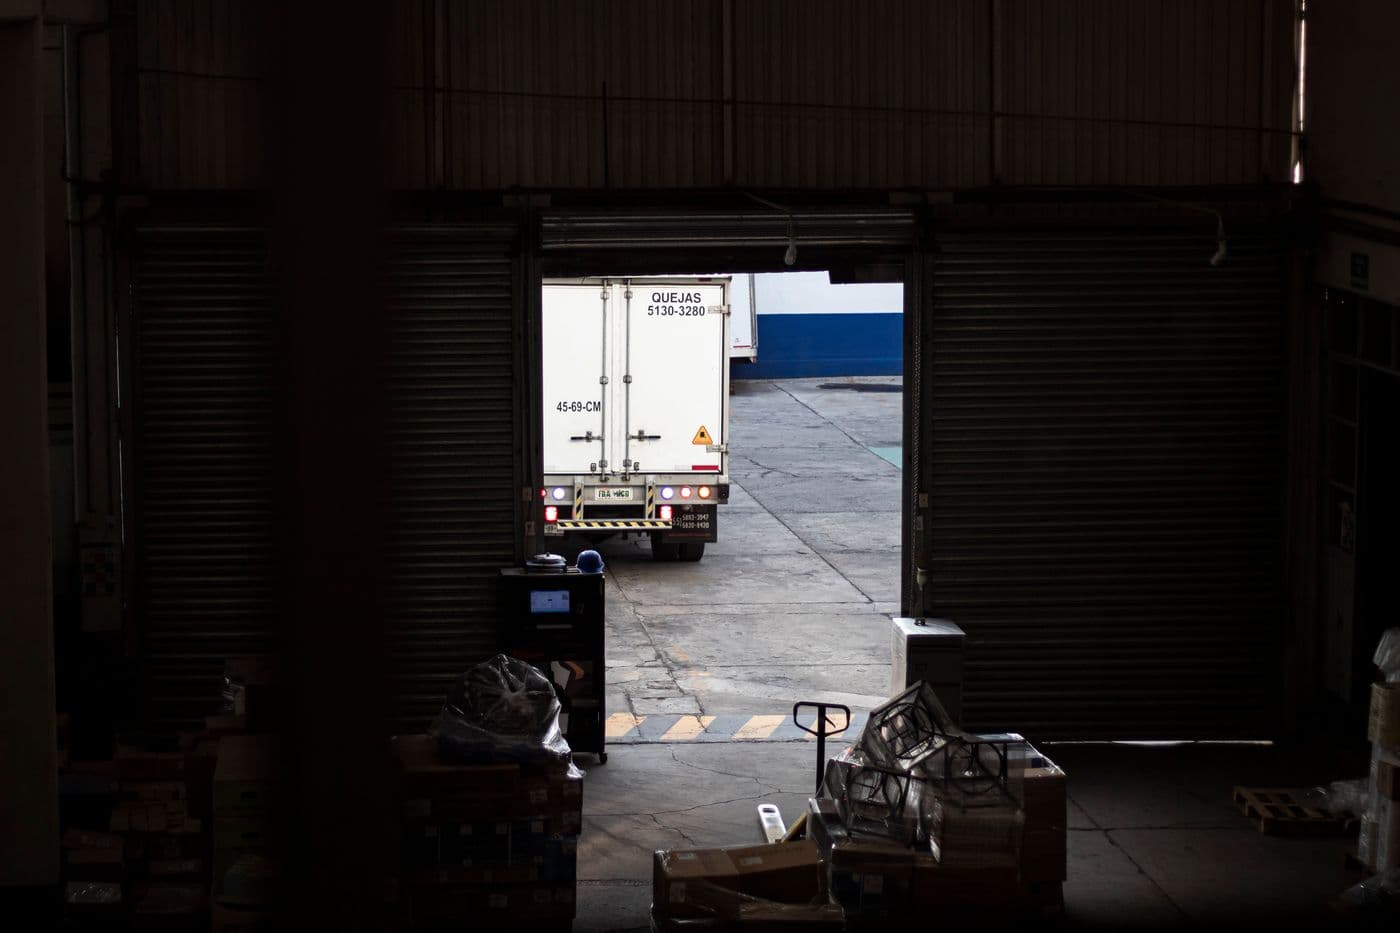
A white box truck seen through a dark warehouse door
What it costs
Penaltiesand lost lanes for late deliveries
Callsto find where a truck is
01OTIF

OTIF misses you hear about last

GPS shows where trucks are. It does not say which deliveries will be late until they are.

What we do
DATAGPS, TMS and orders in one view
AILate delivery predicted hours ahead
ANALYTICSOTIF by customer, lane and transporter
DATAGPS · TMS
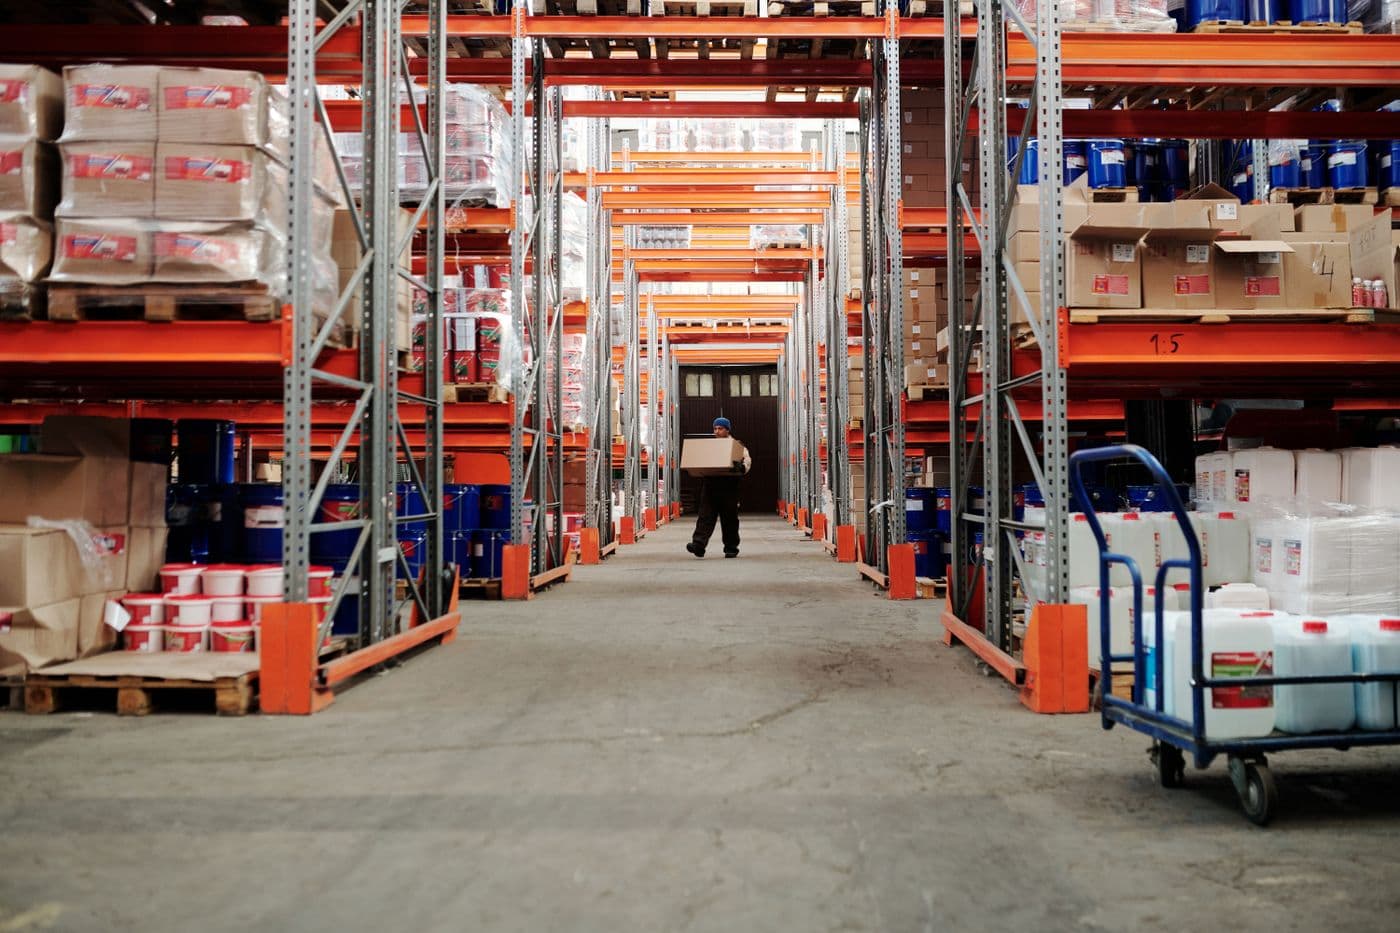
A warehouse worker carrying a box down a long aisle between tall racks
What it costs
15%of time running empty, illustrative
Trucksthat could carry a backhaul
02Utilisation

Empty miles and low utilisation

Return loads are found by phone. Nobody sees which lanes run empty most often.

What we do
ANALYTICSEmpty kilometres by lane and vehicle
AIBackhaul matches suggested from your own orders
ANALYTICSUtilisation by fleet and depot
DATAGPS · TMS · Orders
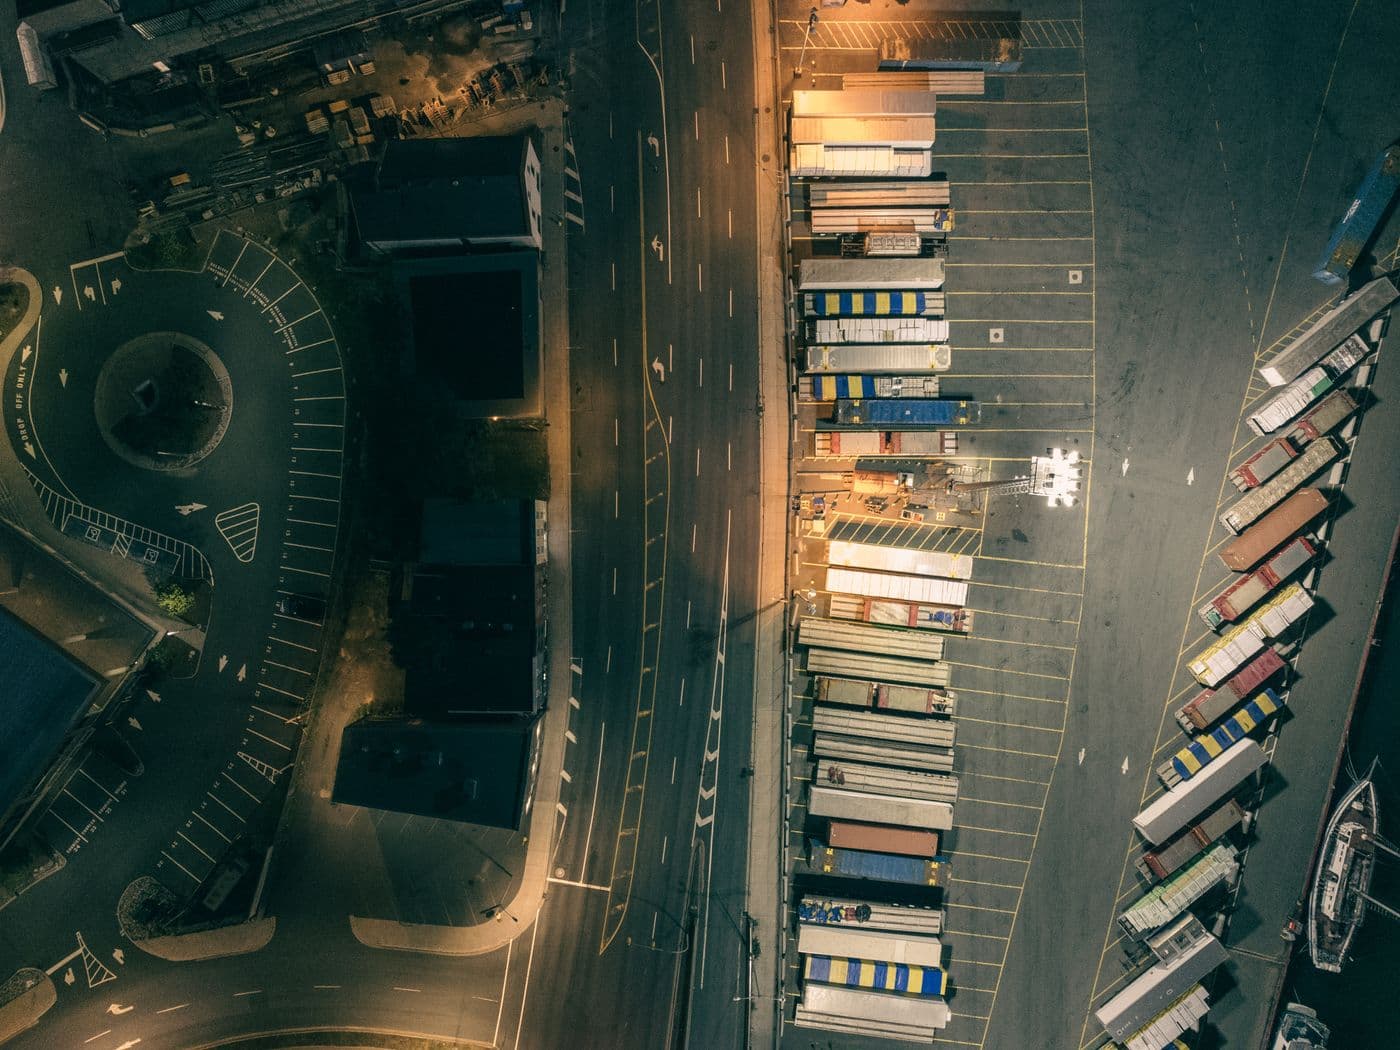
Aerial view at night of freight trailers parked in rows beside a road
What it costs
Hoursper truck lost to waiting
Detentioncharges nobody claims
03Dwell time

Trucks waiting at docks

Gate-in and gate-out times are on paper. Detention is hard to prove, so it is rarely billed.

What we do
DATAGate and dock times captured digitally
ANALYTICSDwell time by customer and site
ANALYTICSDetention charges backed by evidence
DATAGate logs · GPS · WMS
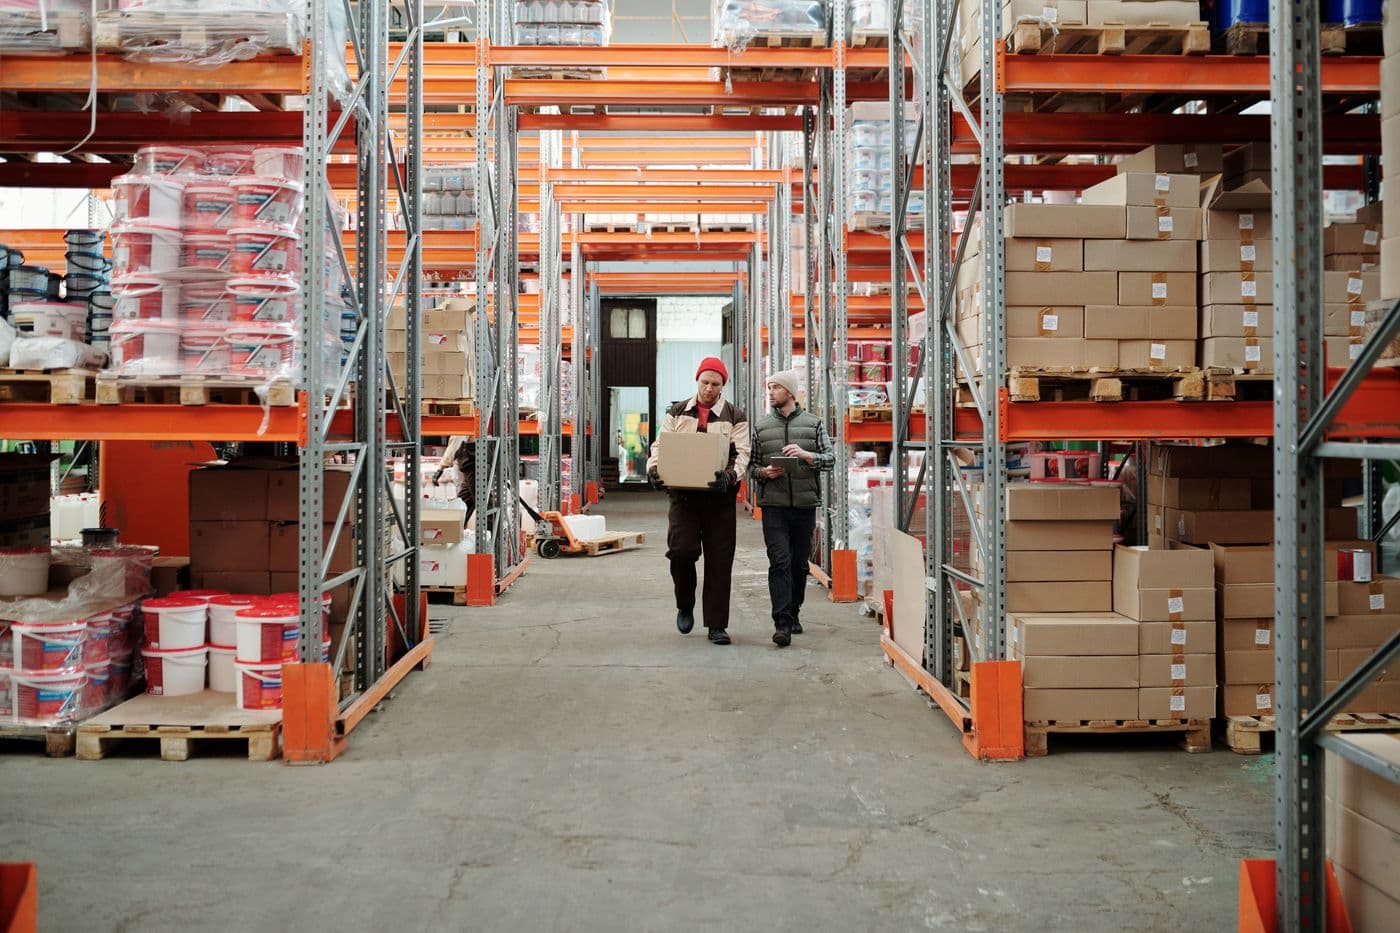
Two warehouse workers walking with a box between tall orange racks
What it costs
$240ka year caught in one woodfrog case
Day 14first anomaly flagged: a fuel surcharge
04Cost per trip

Fuel and freight cost leaks

Contracted rates, surcharges and invoices drift apart. Checking every line by hand is not possible.

What we do
AIContracted rate against invoice, every line
ANALYTICSCost per trip by lane and vendor
ANALYTICSFuel use per kilometre by vehicle
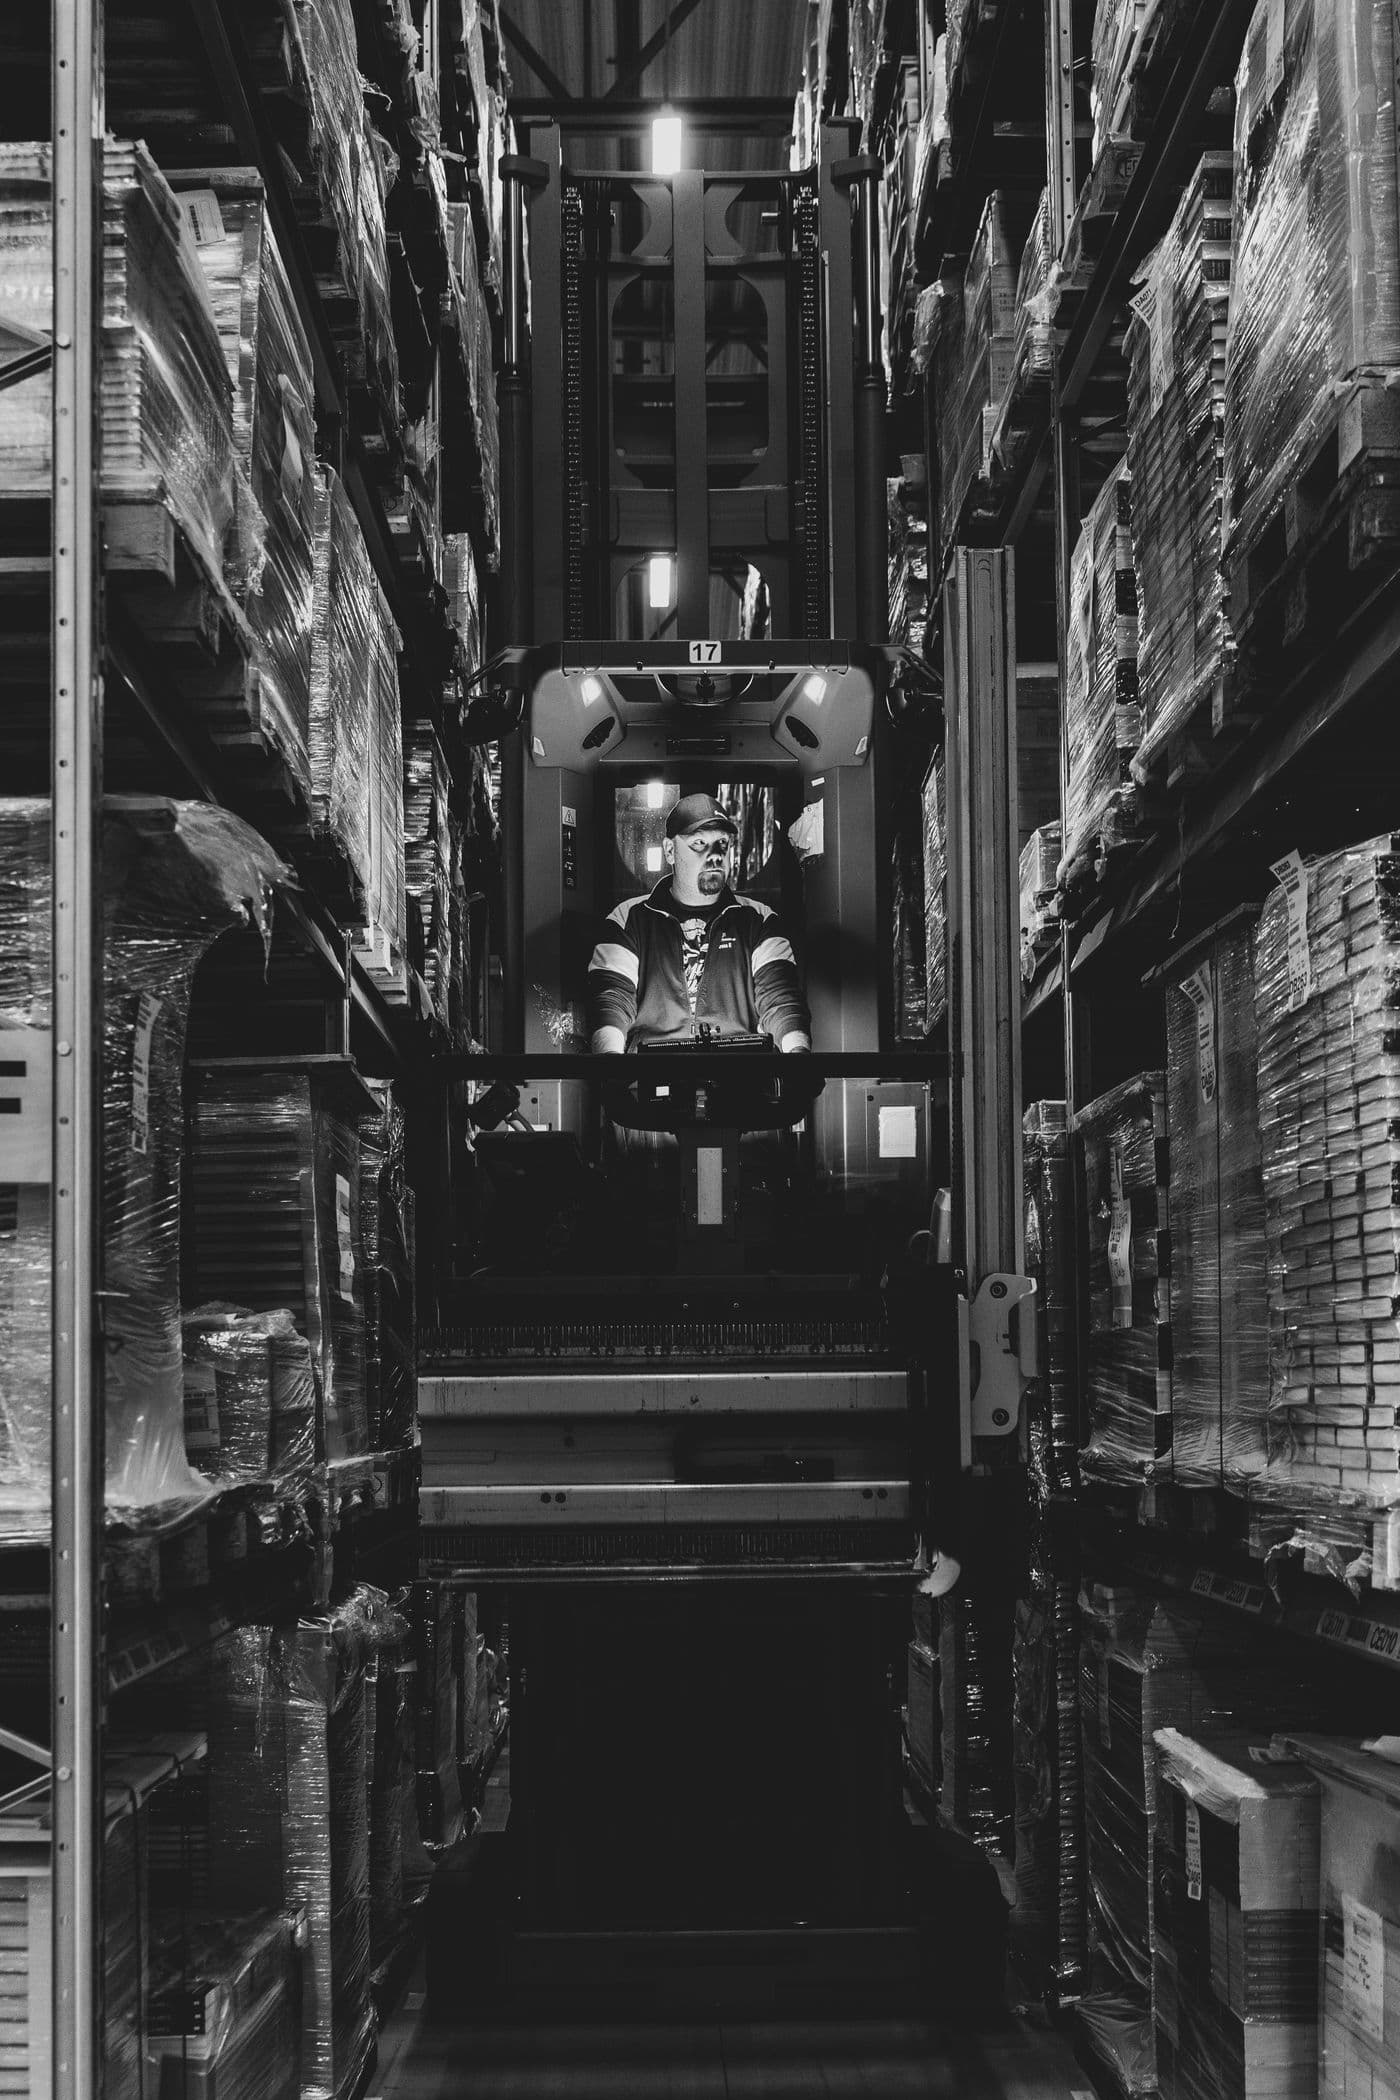
A forklift driver between tall pallet racks in a black and white photo
What it costs
Daysadded to cash collection by missing PODs
Disputesfrom invoices that do not match
05Billing

Billing, PODs and e-way bills

Proof of delivery is a photo on a driver's phone. E-way bills and invoices are typed again.

What we do
DATAPOD, e-way bill and invoice linked to each trip
DATAPaperwork written once, never retyped
ANALYTICSUnbilled and disputed trips tracked
DATATMS · GST portal · SAP · TallyCase: Challans and e-way bills never retyped →
Done before

Already paying back on the road.

All case studies →
Systems we connect

From the gate to the invoice.

Fleet
GPS, telematics, fuel cards
Operations
TMS, WMS, gate and dock logs
Compliance
E-way bills, PODs, GST invoices
Business
SAP, Tally, Excel

Read only to start. Nothing changes in your TMS or WMS until you approve it.

GPS · TMS · WMSYour network
Antvia DataOne governed store
OTIF · Utilisation · CostLive views
A worker walking down a warehouse aisle lined with tall racks
Who you work with

Engineers who know the yard and the dock.

Ananta PatilSamruddhi MoreMandar JoshiParth ManhasPranjul KalsiNarendra P

A small team from Pune, India. The people who walk your site are the people who build it.

Meet the team →
Where we have built
Supply chain costA fuel surcharge anomaly flagged on day 14, $240k saved a year.
Dispatch recordsChallans, e-way bills and invoices written once, in Uloborus.
Data foundationsOne owned definition per measure, with full lineage.
Our promise

At least 3x return, within 12 months of delivery.

Measured on your own numbers: OTIF, utilisation, cost per trip and days to bill.

How we measure it →

Questions logistics heads ask.

Do you replace our TMS or WMS?

No. We read from the systems you already run and put the data together in one place. Nothing changes in your TMS or WMS until you approve it.

Can you use our GPS vendor data?

Usually yes. Most GPS and telematics vendors offer an API or a data export, and we connect to whichever your vendor supports. The first audit confirms what each vendor can give us.

Do drivers need a new app?

Not as a starting point. We begin with the data your drivers, gates and systems already produce. If a signal such as proof of delivery is only on paper or a phone, we say so in the audit and suggest the simplest way to capture it.

Can data stay in India?

Yes. The data store can run on your own servers or in your own cloud account in an Indian region, on open formats, so you are never locked in. We work inside your IT and security rules.

How soon do we see results?

The first live view, for the lane or site we start with, typically comes within the first weeks of the build, once the data is connected. The audit sets the exact plan for your network.

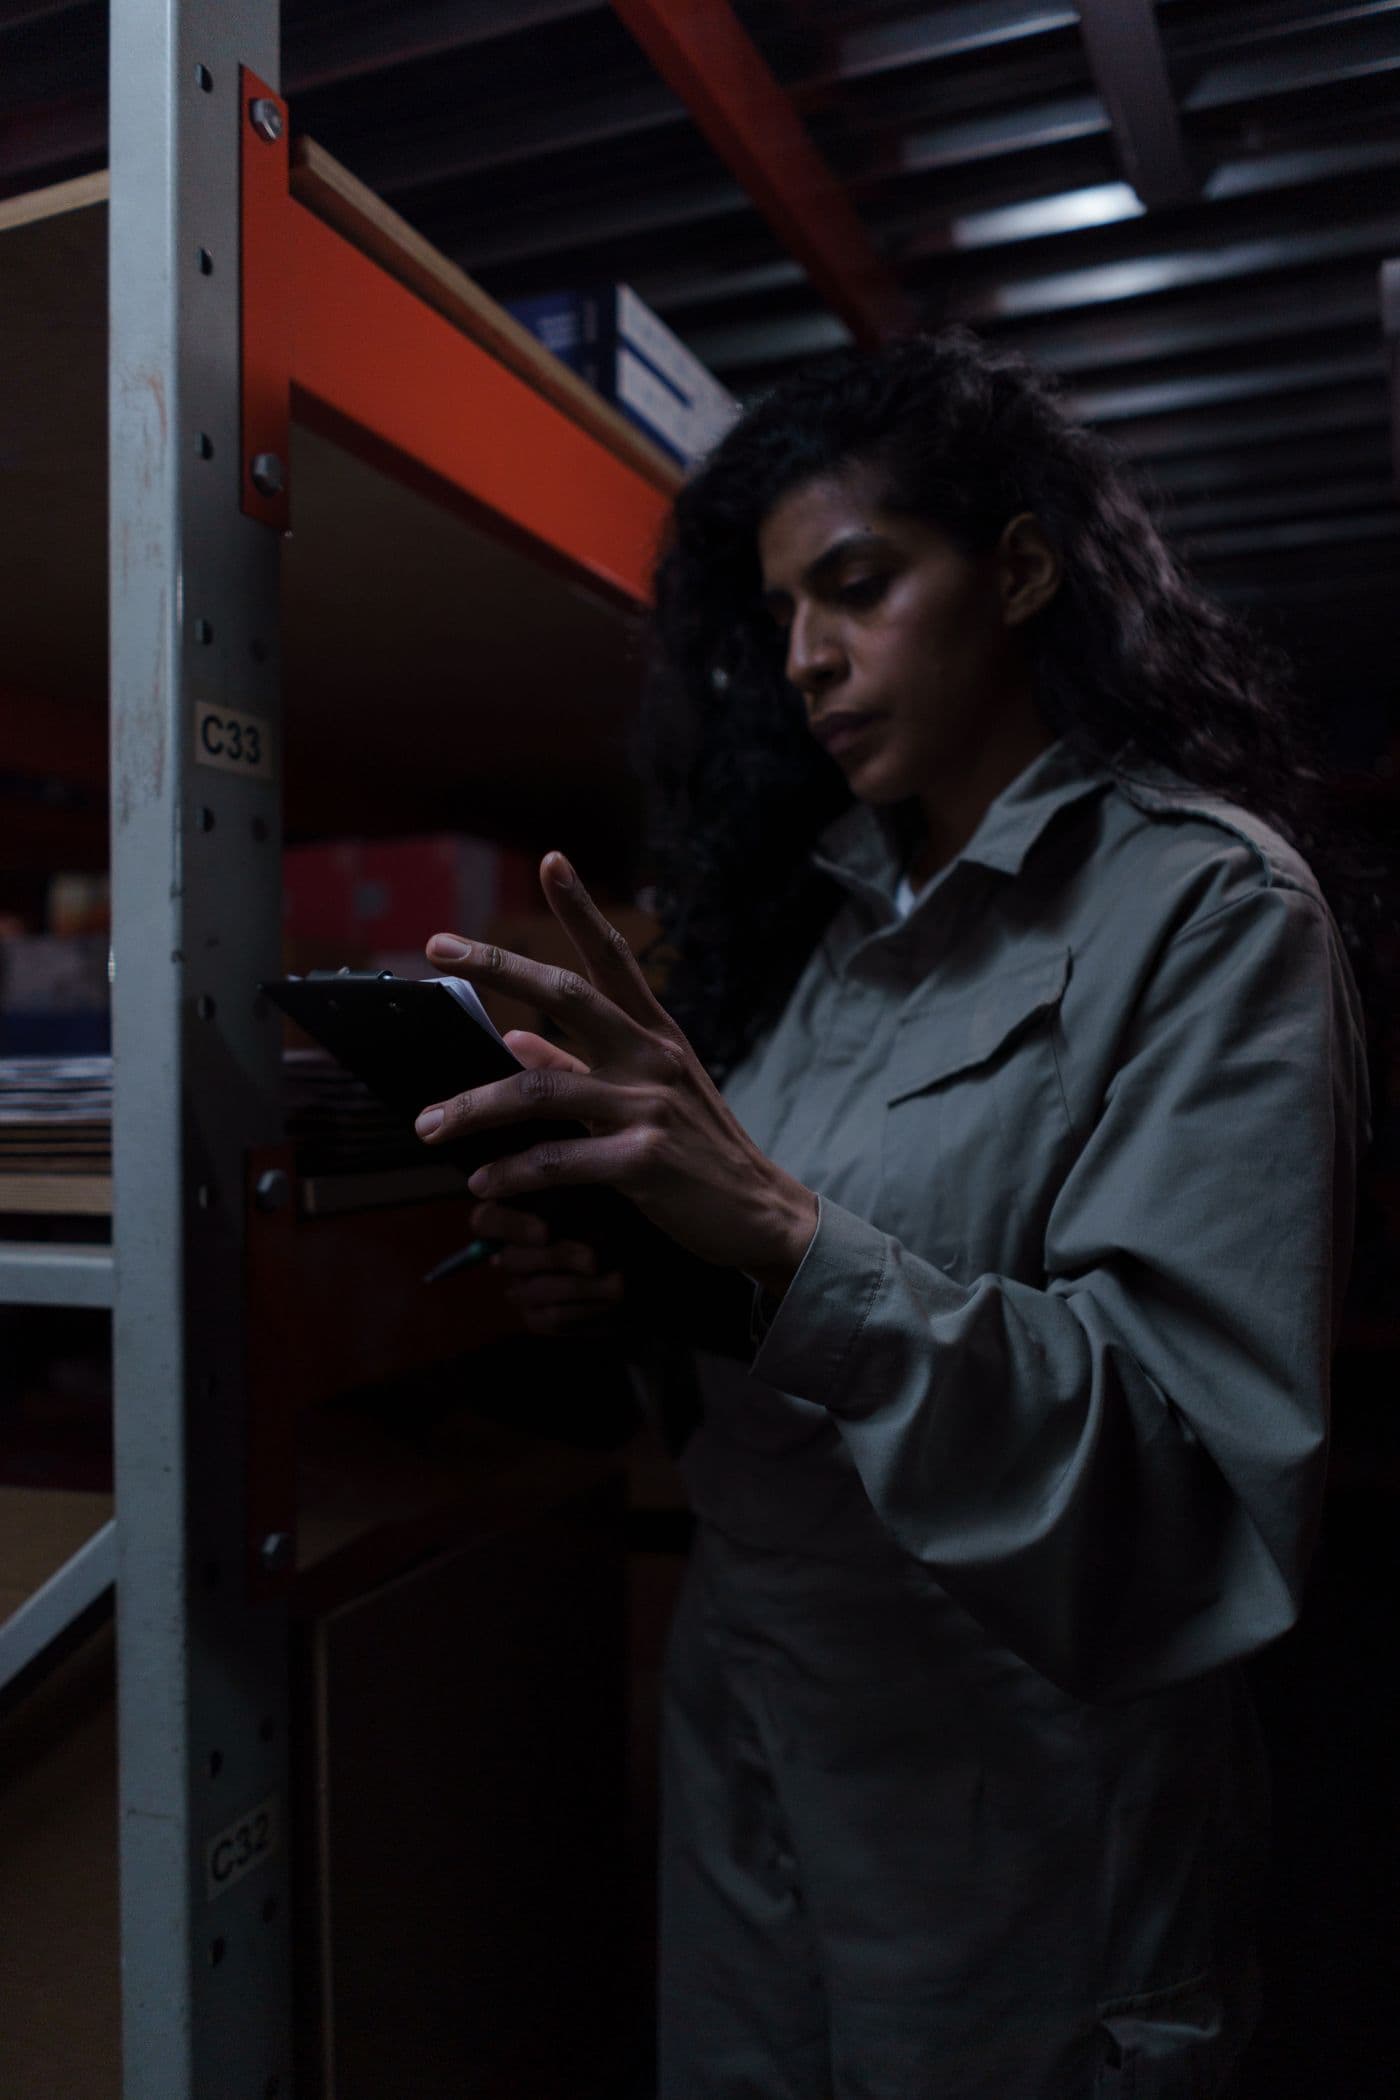
A warehouse worker checking a clipboard beside a rack
Tell us your OTIF.We will show you where the misses start.

Talk to us about your network

Or record your message instead
A person replies within one business day.WhatsApp us